[FIN]CROSS-BORDERVOL: $4.2T
[SEC]CYBER ALERT: TIER2
[POL]IS0 GROWTH:+14%
[GEO] CLOUDINDEX: +2.4%
Structural Logic
Category Filters
Chemical Detection Limits: ppb vs ppm Explained
Lead Author
Published
Views:
Chemical Detection Limits: ppb vs ppm Explained
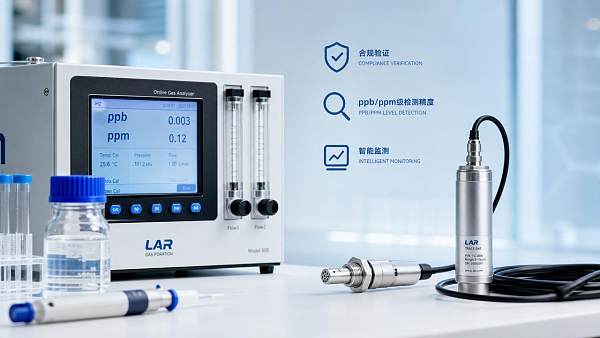
Understanding chemical detection limits (ppb/ppm) is essential for comparing instruments, certification reports, and compliance data across industries.
Whether evaluating TIC results, smart manufacturing controls, environmental monitoring, or safety protocols, ppb and ppm can change a technical decision.
This guide explains chemical detection limits (ppb/ppm) in practical terms, supporting clearer interpretation of sensitivity claims and regulatory evidence.
Why Detection Sensitivity Is Becoming a Strategic Benchmark
Chemical detection is no longer limited to laboratories. It now appears in factories, terminals, logistics systems, schools, hospitals, and financial infrastructure.
As connected devices capture more operational data, chemical detection limits (ppb/ppm) increasingly affect compliance confidence and system credibility.
A sensor advertised as “high sensitivity” may not be suitable when a regulation requires detection at parts-per-billion levels.
The trend is clear: digital transformation raises expectations for traceability, validation, and measurable performance.
In this environment, chemical detection limits (ppb/ppm) become a shared language between testing, procurement, engineering, and compliance functions.
ppb vs ppm: The Practical Difference Behind the Numbers
ppm means parts per million. ppb means parts per billion. Both describe concentration, not instrument quality by themselves.
One ppm equals 1,000 ppb. Therefore, 1 ppb is far smaller than 1 ppm.
For water, 1 ppm often approximates one milligram per liter. One ppb often approximates one microgram per liter.
For air, conversions depend on molecular weight, temperature, pressure, and whether values are expressed by volume or mass.
That is why chemical detection limits (ppb/ppm) must be read together with sample matrix, method, and reporting basis.
The Shift From Basic Compliance to Evidence-Based Validation
Earlier compliance models often accepted pass-or-fail results. Current models demand method transparency, uncertainty data, and audit-ready records.
This shift makes chemical detection limits (ppb/ppm) more than a laboratory specification.
They influence how results are compared across suppliers, regions, instruments, and certification bodies.
The same numeric result may carry different meaning if detection limits, calibration practices, or sample preparation are different.
In global technical intelligence systems, this is a major data-normalization challenge.
Key Drivers Behind the Trend
- Stricter regulations require lower reporting thresholds for contaminants and hazardous substances.
- Smart terminals and IoT sensors create continuous streams of monitoring data.
- Cross-border trade increases reliance on comparable TIC documentation.
- AI analytics require consistent, machine-readable concentration units.
- Public safety expectations raise scrutiny of air, water, food, and materials.
How Chemical Detection Limits Affect Different Business Systems
The impact of chemical detection limits (ppb/ppm) varies by application. A ppm-level device may be acceptable in one environment.
In another environment, the same device may miss critical trace-level contamination.
For smart manufacturing, detection thresholds support process stability, defect prevention, and material release decisions.
For TIC services, chemical detection limits (ppb/ppm) shape certificate reliability and international recognition.
For environmental monitoring, lower limits can reveal early pollution signals before visible operational failure occurs.
For public terminals and education facilities, air quality and material safety depend on credible measurement thresholds.
LOD, LOQ, and Reporting Limits Should Not Be Confused
Many specification sheets mention detection limits without explaining whether they mean LOD, LOQ, or reporting limit.
LOD means limit of detection. It indicates the smallest amount that can be distinguished from background noise.
LOQ means limit of quantitation. It indicates the smallest amount that can be measured with acceptable precision.
The reporting limit is often higher, because laboratories must account for validation, uncertainty, and practical workflow constraints.
When comparing chemical detection limits (ppb/ppm), confirm which limit is being claimed.
Questions That Reveal Real Performance
- Is the value an LOD, LOQ, reporting limit, or alarm threshold?
- Was the value measured in air, water, soil, surface wipe, or product matrix?
- Does the method follow ISO, IEC, EPA, ASTM, or another recognized standard?
- Is uncertainty stated near the claimed ppb or ppm threshold?
- Can calibration data support performance under real operating conditions?
Why Lower Is Not Always Better
A lower detection limit sounds attractive, but it may introduce cost, complexity, and false-positive management issues.
Ultra-low ppb performance can require controlled sampling, skilled operation, and frequent calibration.
In high-throughput settings, ppm-level monitoring may provide faster and more reliable operational control.
The right choice depends on risk, regulation, matrix complexity, and decision consequence.
Therefore, chemical detection limits (ppb/ppm) should be aligned with use case, not selected by headline sensitivity alone.
Interpreting Vendor Claims in Smart and Connected Systems
Connected platforms increasingly integrate chemical sensors with dashboards, alerts, ERP systems, and compliance repositories.
This integration creates value, but it can also hide weak measurement assumptions behind polished interfaces.
Chemical detection limits (ppb/ppm) should be evaluated before dashboard performance, automation logic, or AI prediction claims.
If raw measurement quality is weak, downstream analytics may amplify error rather than reduce risk.
A credible system should link each alert to calibration status, method basis, sample context, and data retention rules.
Core Points to Verify
- Detection range across expected operating temperatures and humidity.
- Interference behavior when similar chemicals appear together.
- Calibration frequency and traceability to recognized reference materials.
- Data integrity controls for audit, cybersecurity, and privacy obligations.
- Compatibility with international documentation practices and compliance workflows.
A Practical Framework for ppb and ppm Decisions
The most useful approach is to connect chemical detection limits (ppb/ppm) with the decision that follows the measurement.
If the decision is regulatory rejection, higher analytical confidence is needed.
If the decision is routine process adjustment, repeatability and response speed may matter more.
If the decision is public safety action, thresholds must balance early warning with operational practicality.
What to Watch as Standards and Platforms Evolve
Future systems will combine laboratory results, field sensors, digital certificates, and predictive models.
This makes chemical detection limits (ppb/ppm) central to data interoperability and automated compliance decisions.
Expect stronger requirements for metadata, method traceability, uncertainty disclosure, and validation under realistic conditions.
Platforms that normalize ppb and ppm data correctly will support better benchmarking across regions and industries.
Platforms that ignore measurement context may create misleading risk scores and unreliable alerts.
Recommended Next Steps
- Map each chemical measurement to its operational or regulatory decision.
- Record whether each threshold is expressed in ppb, ppm, mass, or volume.
- Check whether LOD, LOQ, and reporting limit are clearly separated.
- Require method references and calibration evidence for critical results.
- Review connected systems for data integrity, traceability, and audit readiness.
Moving From Sensitivity Claims to Reliable Decisions
The difference between ppb and ppm is simple mathematically, but powerful in operational reality.
Strong decisions require more than a smaller number on a datasheet.
They require verified methods, suitable matrices, clear reporting limits, and consistent documentation.
For digital service ecosystems and smart terminals, chemical detection limits (ppb/ppm) are now part of trusted infrastructure.
Use the next evaluation cycle to audit measurement requirements, compare evidence, and align detection performance with real-world risk.
Tags
Recommended for You
 How to review SDSs before buying high-temperature antioxidants in bulkPlanning high temperature antioxidants bulk purchases? Learn how to review SDSs, assess handling and thermal hazards, and uncover hidden costs before approving your next order.Oct 20, 2026Marcus Trust
 Illinois Digital Asset Kiosk Operators Refund Over $750,000 Under DAKAIllinois digital asset kiosk operators refund over $750,000 under DAKA. Explore scam refund protections, fee caps, and transaction limits—and learn what they mean for consumers.Oct 20, 2026Dr. Hideo Tanaka
 What capacity roller mill do you need for wheat flour production?Choose the right roller mill for wheat flour by matching capacity to output, extraction rate, and operating hours. Learn how to compare suppliers and avoid costly bottlenecks.Oct 19, 2026Lina Cloud
 How does the required frequency range affect EMC testing costs?EMC test frequency range cost depends on equipment, test methods, and product complexity. Learn how to compare lab quotes, avoid hidden charges, and budget smarter.Oct 18, 2026Marcus Trust
 How digital classrooms shape the education infrastructure marketEducation Infrastructure market analysis reveals how digital classrooms reshape spending on connectivity, software, and support. Explore growth opportunities and smarter investment decisions.Oct 17, 2026Lina Cloud
 How to verify the safe load capacity of HDPE aquaculture modulesVerify the safe load capacity of HDPE aquaculture modules with practical guidance on buoyancy, stability, connections, and long-term performance. Learn what to check before approving loads.Oct 16, 2026Marcus Trust
 How to choose a target country for market penetration in EuropePlan Market Penetration in Europe with confidence. Learn how to compare demand, regulations, competition, and delivery costs to choose the right country for sustainable growth.Oct 15, 2026Lina Cloud
 ISO/IEC 27001:2026 Officially Published for Information Security ManagementISO/IEC 27001:2026: Explore the reported update for cloud CRM, payment gateways and AI-ERP. Discover what to verify before planning certification and procurement changes.Oct 15, 2026Marcus Trust
 How to verify food-grade compliance for wholesale locust bean gumEvaluating locust bean gum wholesale suppliers? Learn how to verify food-grade compliance, check batch reports, and confirm traceability to reduce sourcing risks and buy with confidence.Oct 14, 2026Marcus Trust
 What Drives Data Compliance Software Costs Beyond the License Fee?Explore data compliance software costs beyond the license fee, from integrations and training to usage charges. Uncover hidden expenses and compare vendors with confidence.Oct 19, 2026Marcus Trust
 Privacy Software for Compliance Officers: Streamlining Assessments and ApprovalsExplore privacy software for compliance officers to streamline assessments, connect evidence, and track approval conditions. Learn how to reduce review delays and keep decisions audit-ready.Oct 18, 2026Marcus Trust
 Evaluating Privacy Risk Management Software: Scoring and Remediation WorkflowsEvaluate privacy risk management software with practical tests for transparent scoring, accountable remediation, and verified risk reduction. Discover how to choose a platform you can trust.Oct 17, 2026Marcus Trust
 DSAR Compliance Software: Resolving Identity Checks and Missed DeadlinesDSAR compliance software helps streamline identity checks, track legal deadlines, and unblock stalled requests. Discover practical ways to reduce delays and build auditable workflows.Oct 16, 2026Marcus Trust
 Best Enterprise Tools for Cross-Border Video Privacy: What to CompareCompare the best enterprise tools for cross-border video privacy compliance. Explore data residency, access controls, redaction, and retention to choose the right solution.Oct 15, 2026Marcus Trust
 Which Privacy Platforms Support GDPR, CCPA, and Cross-Jurisdiction Workflows?Which privacy platforms support cross-jurisdiction compliance? Compare GDPR and CCPA workflows, data discovery, and audit evidence to shortlist the right solution.Oct 14, 2026Marcus Trust
 What should schools check before choosing a payment gateway?What should schools check before choosing a payment gateway? Discover key security, integration, fee, and settlement checks to simplify collections and choose with confidence.Oct 19, 2026Dr. Marcus Fin
 Does PCI DSS apply when schools accept online payments?Is PCI-DSS relevant when schools accept online payments? Learn how to reduce compliance scope, choose the right SAQ, and verify payment providers to protect your school.Oct 18, 2026Dr. Marcus Fin
 How do you create a regional compliance map for EdTech?How do we create a regional compliance map for EdTech? Explore practical steps to map privacy rules, data flows, accessibility, and launch controls for confident regional expansion.Oct 17, 2026Marcus Trust
 What data privacy risks are common in interactive classrooms?Which data privacy risks are common in interactive classrooms? Explore tracking, weak access controls, and AI data reuse—and learn practical ways to protect students.Oct 16, 2026Lina Cloud
 How often should smart terminals receive security updates?How often should smart terminals receive security updates? Discover practical patch schedules, urgent threat priorities, and safe rollout strategies to protect devices and reduce downtime.Oct 15, 2026Lina Cloud
 What happens to school data when a cloud contract ends?What happens to school data when a cloud contract ends? Learn how to secure usable exports, manage access deadlines, and verify deletion to protect student records and avoid costly exit risks.Oct 14, 2026Professor Sarah Ed
 How to clear jams safely in an automatic lentil splitting machineAutomatic lentil splitting machine jammed? Learn safe lockout steps, approved clearing methods, and restart checks to protect operators and reduce repeat blockages.Oct 13, 2026Marcus Trust
 How to keep AI-assisted learning content aligned with course goalsAI assisted learning content: learn how to align lessons, quizzes, and feedback with course goals using clear objectives, expert review, compliance guardrails, and learner data.Oct 12, 2026Professor Sarah Ed
 What documents should a bulk defoamers exporter provide?Bulk defoamers exporter documentation guide: discover essential SDS, CoA, TDS, customs, transport, and compliance files for safer global sourcing.Oct 11, 2026Marcus Trust
 How to evaluate PCI DSS compliance tools for continuous control monitoringPCI DSS compliance tools: learn how to evaluate continuous control monitoring, evidence quality, integrations, and remediation workflows for audit-ready security.Oct 10, 2026Lina Cloud
 When is an FRP fish tank a better choice than glass?FRP fish tank vs. glass: discover when fiberglass offers superior durability, custom shapes, outdoor resilience, and easier installation for your aquarium project.Oct 09, 2026Marcus Trust
 What yield should a commercial salmon filleting machine deliver?Fish filleting machine commercial for salmon: learn how to evaluate realistic yield, saleable output, throughput, trim quality, labor needs, and supplier trial results.Oct 08, 2026Marcus Trust
 How to calculate enclosed belt conveyor capacity for bulk materialsEnclosed belt conveyor capacity explained: calculate bulk-material throughput with effective area, belt speed, density, fill limits, and practical design checks.Oct 07, 2026Lina Cloud
 How to verify an electronics recycling certification before hiring a recyclerElectronics recycling certification verification made simple: check validity, scope, accreditation, data security, and downstream controls before hiring a recycler.Oct 06, 2026Marcus Trust
 How to verify CE compliance for a rotary rack oven before purchaseRotary rack oven CE verification made simple: check model-specific declarations, markings, gas and electrical documentation before purchase to prevent costly compliance delays.Oct 05, 2026Marcus Trust
 How to prevent nutrient runoff from aquaculture waste managementAquaculture & Fishery waste management: prevent nutrient runoff with smarter feeding, solids capture, sludge control, treatment, and monitoring.Oct 04, 2026Marcus Trust
 How to verify safety documentation when buying organic solvents wholesaleOrganic solvents wholesale buyers: learn how to verify SDS, CoA, labels, batch traceability, and transport records before delivery. Reduce compliance risks and purchase with confidence.Oct 03, 2026Marcus Trust
 What hygiene standards should a stainless steel cattle slaughtering line meet?Stainless steel cattle slaughtering line hygiene standards: explore hygienic design, zoning, drainage, sanitation, and compliance essentials for safer beef processing.Oct 02, 2026Marcus Trust
 Digital classroom integration examples that improve lesson flowDigital classroom integration examples that improve lesson flow, connect teaching tools, streamline support, and create reliable, engaging learning experiences.Oct 01, 2026Professor Sarah Ed
 Which CE documents should accompany peanut shelling machines?Peanut shelling machines CE guide: learn which documents—Declaration of Conformity, manuals, technical files, and risk assessments—protect imports and compliance.Sep 30, 2026Marcus Trust
 How to verify whether organic Tribulus terrestris extract is certifiedVerify tribulus terrestris extract organic certification with confidence. Learn how to check certificate scope, botanical identity, certifier validity, lot traceability, and processing details.Sep 29, 2026Marcus Trust
 How to prevent uneven feed in a stainless liquid adding machineStainless liquid adding machine feed issues? Learn practical ways to prevent uneven dosing, reduce air leaks, stabilize flow, and improve production consistency.Sep 28, 2026Lina Cloud
 How to verify aquaculture utilities compliance before a site auditAquaculture utilities compliance: learn how to verify water, power, wastewater, alarms, and records before a site audit to reduce risk and prove control.Sep 27, 2026Marcus Trust
 How to size a tunnel oven for a biscuits factory’s target outputTunnel oven for biscuits factory sizing: learn how to match output targets, band loading, bake time, zones, and cooling capacity for reliable production.Sep 26, 2026Lina Cloud
 What purity specifications matter when sourcing bulk magnesium stearate in North America?Bulk magnesium stearate North America buyers: learn the purity specifications that protect quality, compliance, and production performance.Sep 25, 2026Marcus Trust